Dashboard
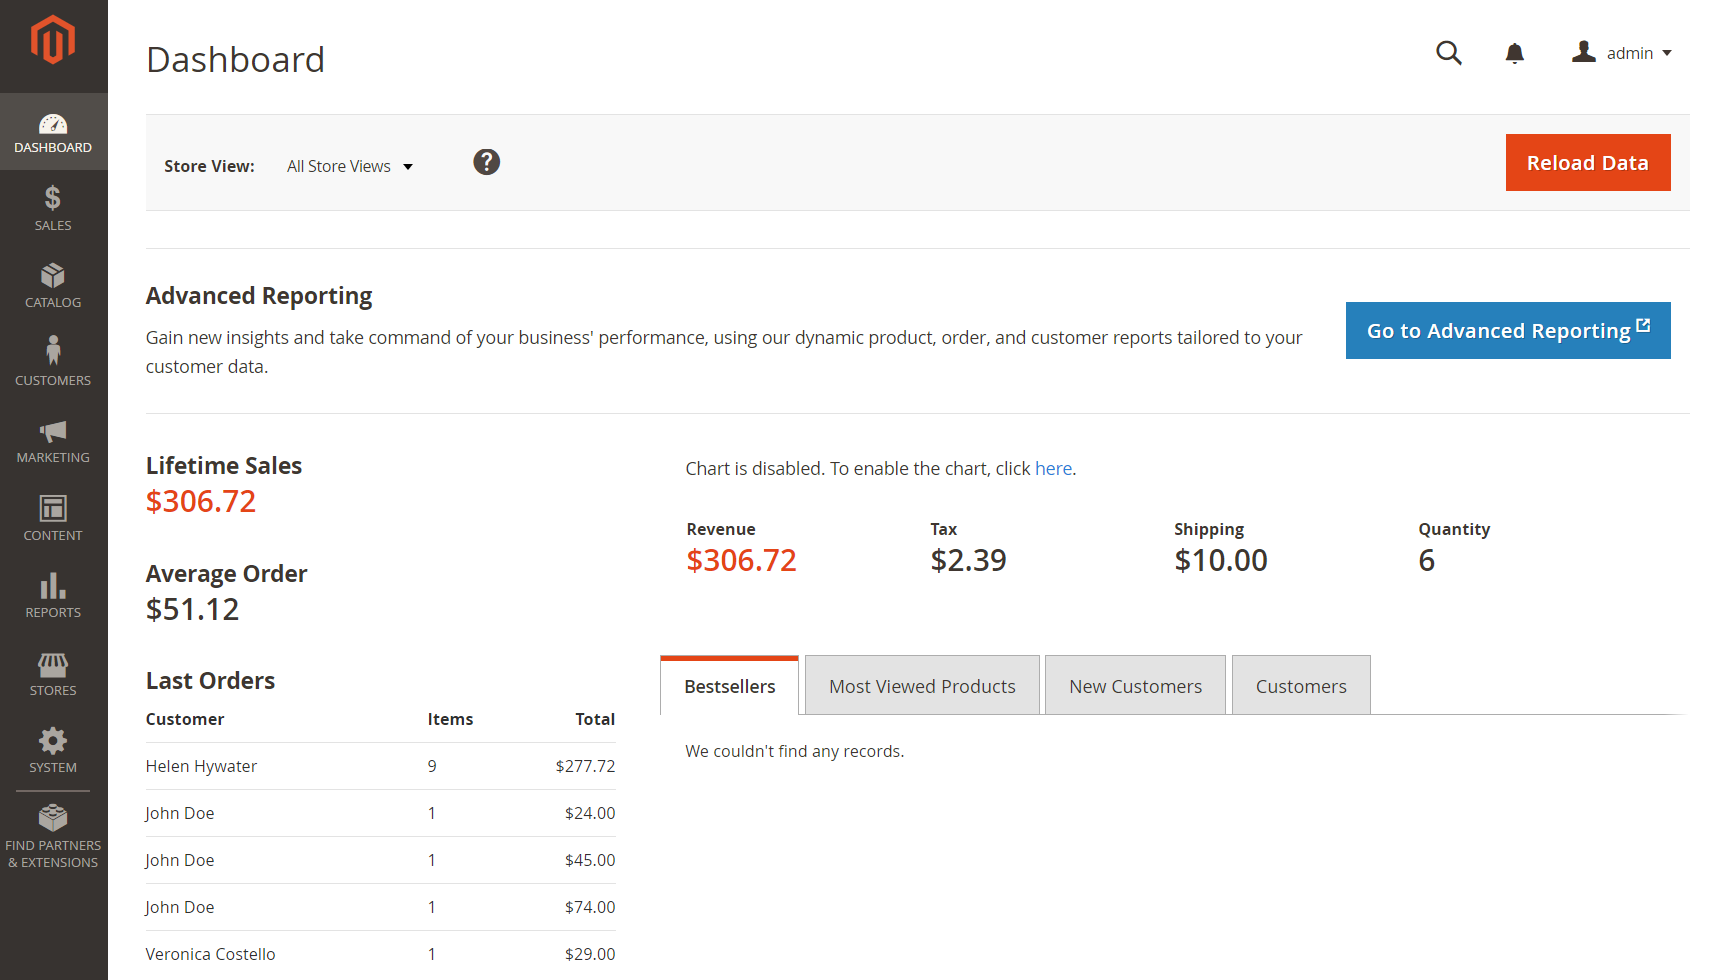
The dashboard is usually the first page that appears when you log in to the Admin, and gives an overview of sales and customer activity. The blocks on the left provide a snapshot of lifetime sales, average order amount, the last five orders, and search terms. The graph shows the orders and amounts for the selected date range. You can use the tabs above the graph to toggle between the two views. The tabs at the bottom provide quick reports about your best-selling products, most viewed products, new customers, and customers who have purchased the most.
The dashboard is the default startup page for the Admin, although you can change the configuration to display a different page when you log in. You can also set the starting dates used in dashboard reports and disable the display of the charts section.
You can produce Dashboard snapshot reports for each store view. The tabs at the bottom of the page summarize your best-selling and most viewed products, new customers, and those who have purchased the most during the time period specified.
 Dashboard
Configure the chart
On the Admin sidebar, go to Stores > Settings > Configuration and complete any of the following settings.
When your configurations are complete, click Save Config.
Enable charts
-
In the left side panel under Advanced, choose Admin.
-
Click to expand the Dashboard section.
-
Clear the Use system value checkbox and set Enable Charts to
Yes.
Set the beginning dates
-
In the left side panel under General, choose Reports.
-
Click to expand the Dashboard section.
-
Clear the Use system value check boxes for the date settings.
-
Set Year-To-Date Starts to the Month and Day.
-
Set Current Month Starts to the Day.
Choose the data source
If you have a lot of data to process, the performance of the Dashboard can be improved by turning off the display of real time data.
-
In the left side panel, click to expand Sales and choose Sales.
-
Click to expand the Dashboard section.
-
Clear the Use system value checkbox and set Use Aggregated Data (beta).
For real-time data, choose
Yes. For historical data, chooseNo.
Change the Startup Page
-
In the left side panel, click to expand Advanced and choose Admin.
-
Click to expand the Startup Page section.
-
Clear the Use system value checkbox and choose the Startup Page that you want to appear when you log in to the Admin.
The list includes every page in the Admin menu structure.
Snapshot data
| Section | Description |
|---|---|
| Lifetime Sales | The aggregated total sales during the lifetime of the store. |
| Average Order | The average order amount during the lifetime of the store. |
| Last Orders | A summary of the last five placed orders. |
| Last Search Terms | The last five search terms. |
| Top Search Terms | The five most commonly-used search terms. |
Dashboard Reports
| Report | Description |
|---|---|
| Sales | The Dashboard reports on Lifetime Sales, Revenue, Tax, Shipping, and Quantity for the time period specified. |
| Orders | The Orders tab at the top displays a chart of all orders during the specified time period. Below the chart is the total revenue, tax, shipping, and quantity ordered. The lifetime sales amount and the last five orders are on the left. |
| Amounts | The Amounts tab at the top displays a chart of all order amounts during the specified time period. The average order amount and the last five orders are on the left. |
| Search Terms | The last five search terms, and top five search terms appear on the left. |
| Products | The Bestsellers tab shows the price and quantity ordered of your best-selling products. The products that have been viewed the most during the specified time period are listed on the Most Viewed Products tab. |
| Customers | The Customers tab at the bottom lists the customers who have ordered the most during the specified range of time. The New Customers tab lists all new customers who have registered for an account during the time period. On the left, the Last Orders section lists the most recent orders by customer. |


