
Forecast content requests
Estimate your storefront’s monthly content requests by combining page measurements with expected traffic in the forecast calculator. To learn which requests count toward your allowance, see Content requests overview.
Quick start
Section titled “Quick start”The forecast calculator uses these inputs:
| Input | How to get it |
|---|---|
| Monthly page views by page type | Existing-site analytics or expected traffic |
| Content requests per page view | Measure typical pages in Chrome or Edge |
| Unopened prerenders per page view | Count unopened prerendered pages while browsing as a shopper |
| Headroom for other traffic (optional) | Compare CDN or server logs with analytics |
Count content requests per page view
Section titled “Count content requests per page view”To estimate the content requests per page view for your forecast, measure a typical page of each type. Page types include home, category, product, content, cart, checkout, and account pages.
Use the results in the forecast calculator:
- Home, category, and product pages: Enter each measurement in its matching row.
- All other pages: Enter the average of your remaining measurements.
-
Open a page on your storefront in Chrome or Edge.
 The examples on this page use this Adobe demo product page.
-
Open your browser’s developer tools, select the Network tab, select Disable cache, and then reload the page.
Disabling the cache shows the requests a first-time visitor makes.
You don’t need to interact with the page. Actions that only send Commerce API calls add no content requests. A new page is a separate page view, and unopened prerendered pages are measured separately.
Count the requests with the script, or check each one in the Network panel.
The script applies the counting rules to requests the browser already recorded. It doesn’t change the page or send data anywhere.
-
Select the Console tab, copy the following script, paste it, and press Enter.
Console (async () => {53 collapsed linesconst [page] = performance.getEntriesByType('navigation');if (!page?.contentType?.includes('html')) {console.warn('This browser does not report response types. Use a current version of Chrome or Edge.');return;}console.log('Waiting for the page to finish loading...');const loading = '[data-section-status]:not([data-section-status="loaded"]), '+ '[data-block-status]:not([data-block-status="loaded"])';const start = Date.now();let quietSince = start;let lastCount = 0;while (Date.now() - quietSince < 2000) {if (Date.now() - start > 30000) {console.warn('The page was still loading after 30 seconds. The results might be incomplete.');break;}const count = performance.getEntriesByType('resource').length;if (count !== lastCount || document.querySelector(loading)) {lastCount = count;quietSince = Date.now();}await new Promise((resolve) => setTimeout(resolve, 250));}const resources = performance.getEntriesByType('resource');if (resources.length >= 250) {console.warn('The browser might not have recorded every request. Check the results in the Network panel.');}const excluded = [[/\.plain\.html$/, 'HTML fragment'],[/\/placeholders\//, 'Placeholder file'],[/\/(placeholders?|query-index|form-data|config)\.json$/, 'Common Edge Delivery JSON file'],[/graphql$/, 'Commerce API call'],];const rows = [];let html = 0;let json = 0;for (const entry of [page, ...resources]) {if (!entry.name.startsWith(location.origin)) continue;let type = '';if (entry.contentType.includes('html')) type = 'HTML';if (entry.contentType.includes('json')) type = 'JSON';if (!type) continue;const { pathname } = new URL(entry.name);const reason = entry.responseStatus >= 300? 'Redirect or error': excluded.find(([pattern]) => pattern.test(pathname))?.[1];if (!reason && type === 'HTML') html += 1;if (!reason && type === 'JSON') json += 1;rows.push({ request: pathname, type, counted: reason ? `No: ${reason}` : 'Yes' });}console.table(rows);const total = Math.round((html + json / 5) * 100) / 100;console.log(`Content requests per page view: ${html} HTML + ${json} JSON ÷ 5 = ${total}`);})();If Chrome warns you about pasting, type
allow pasting, press Enter, and then paste the script again. -
Read the result at the end of the console output.
The script waits a few seconds for the page to finish loading. The table lists each HTML and JSON request from your storefront’s domain and whether it counts. The last line shows the total, such as
Content requests per page view: 1 HTML + 1 JSON ÷ 5 = 1.2.
The script identifies Commerce API calls by URLs ending in graphql. Check Commerce requests on other paths in the Network panel.
Use this method to check individual requests, or if the script shows a warning.
-
In the Network tab, enter the following filter in the Filter box. Replace
www.example.comwith your storefront’s domain.domain:www.example.com mime-type:text/htmlAt the bottom of the Network panel, record the number before the slash as your HTML count.
If nothing appears, check the domain and reload with the Network tab open.
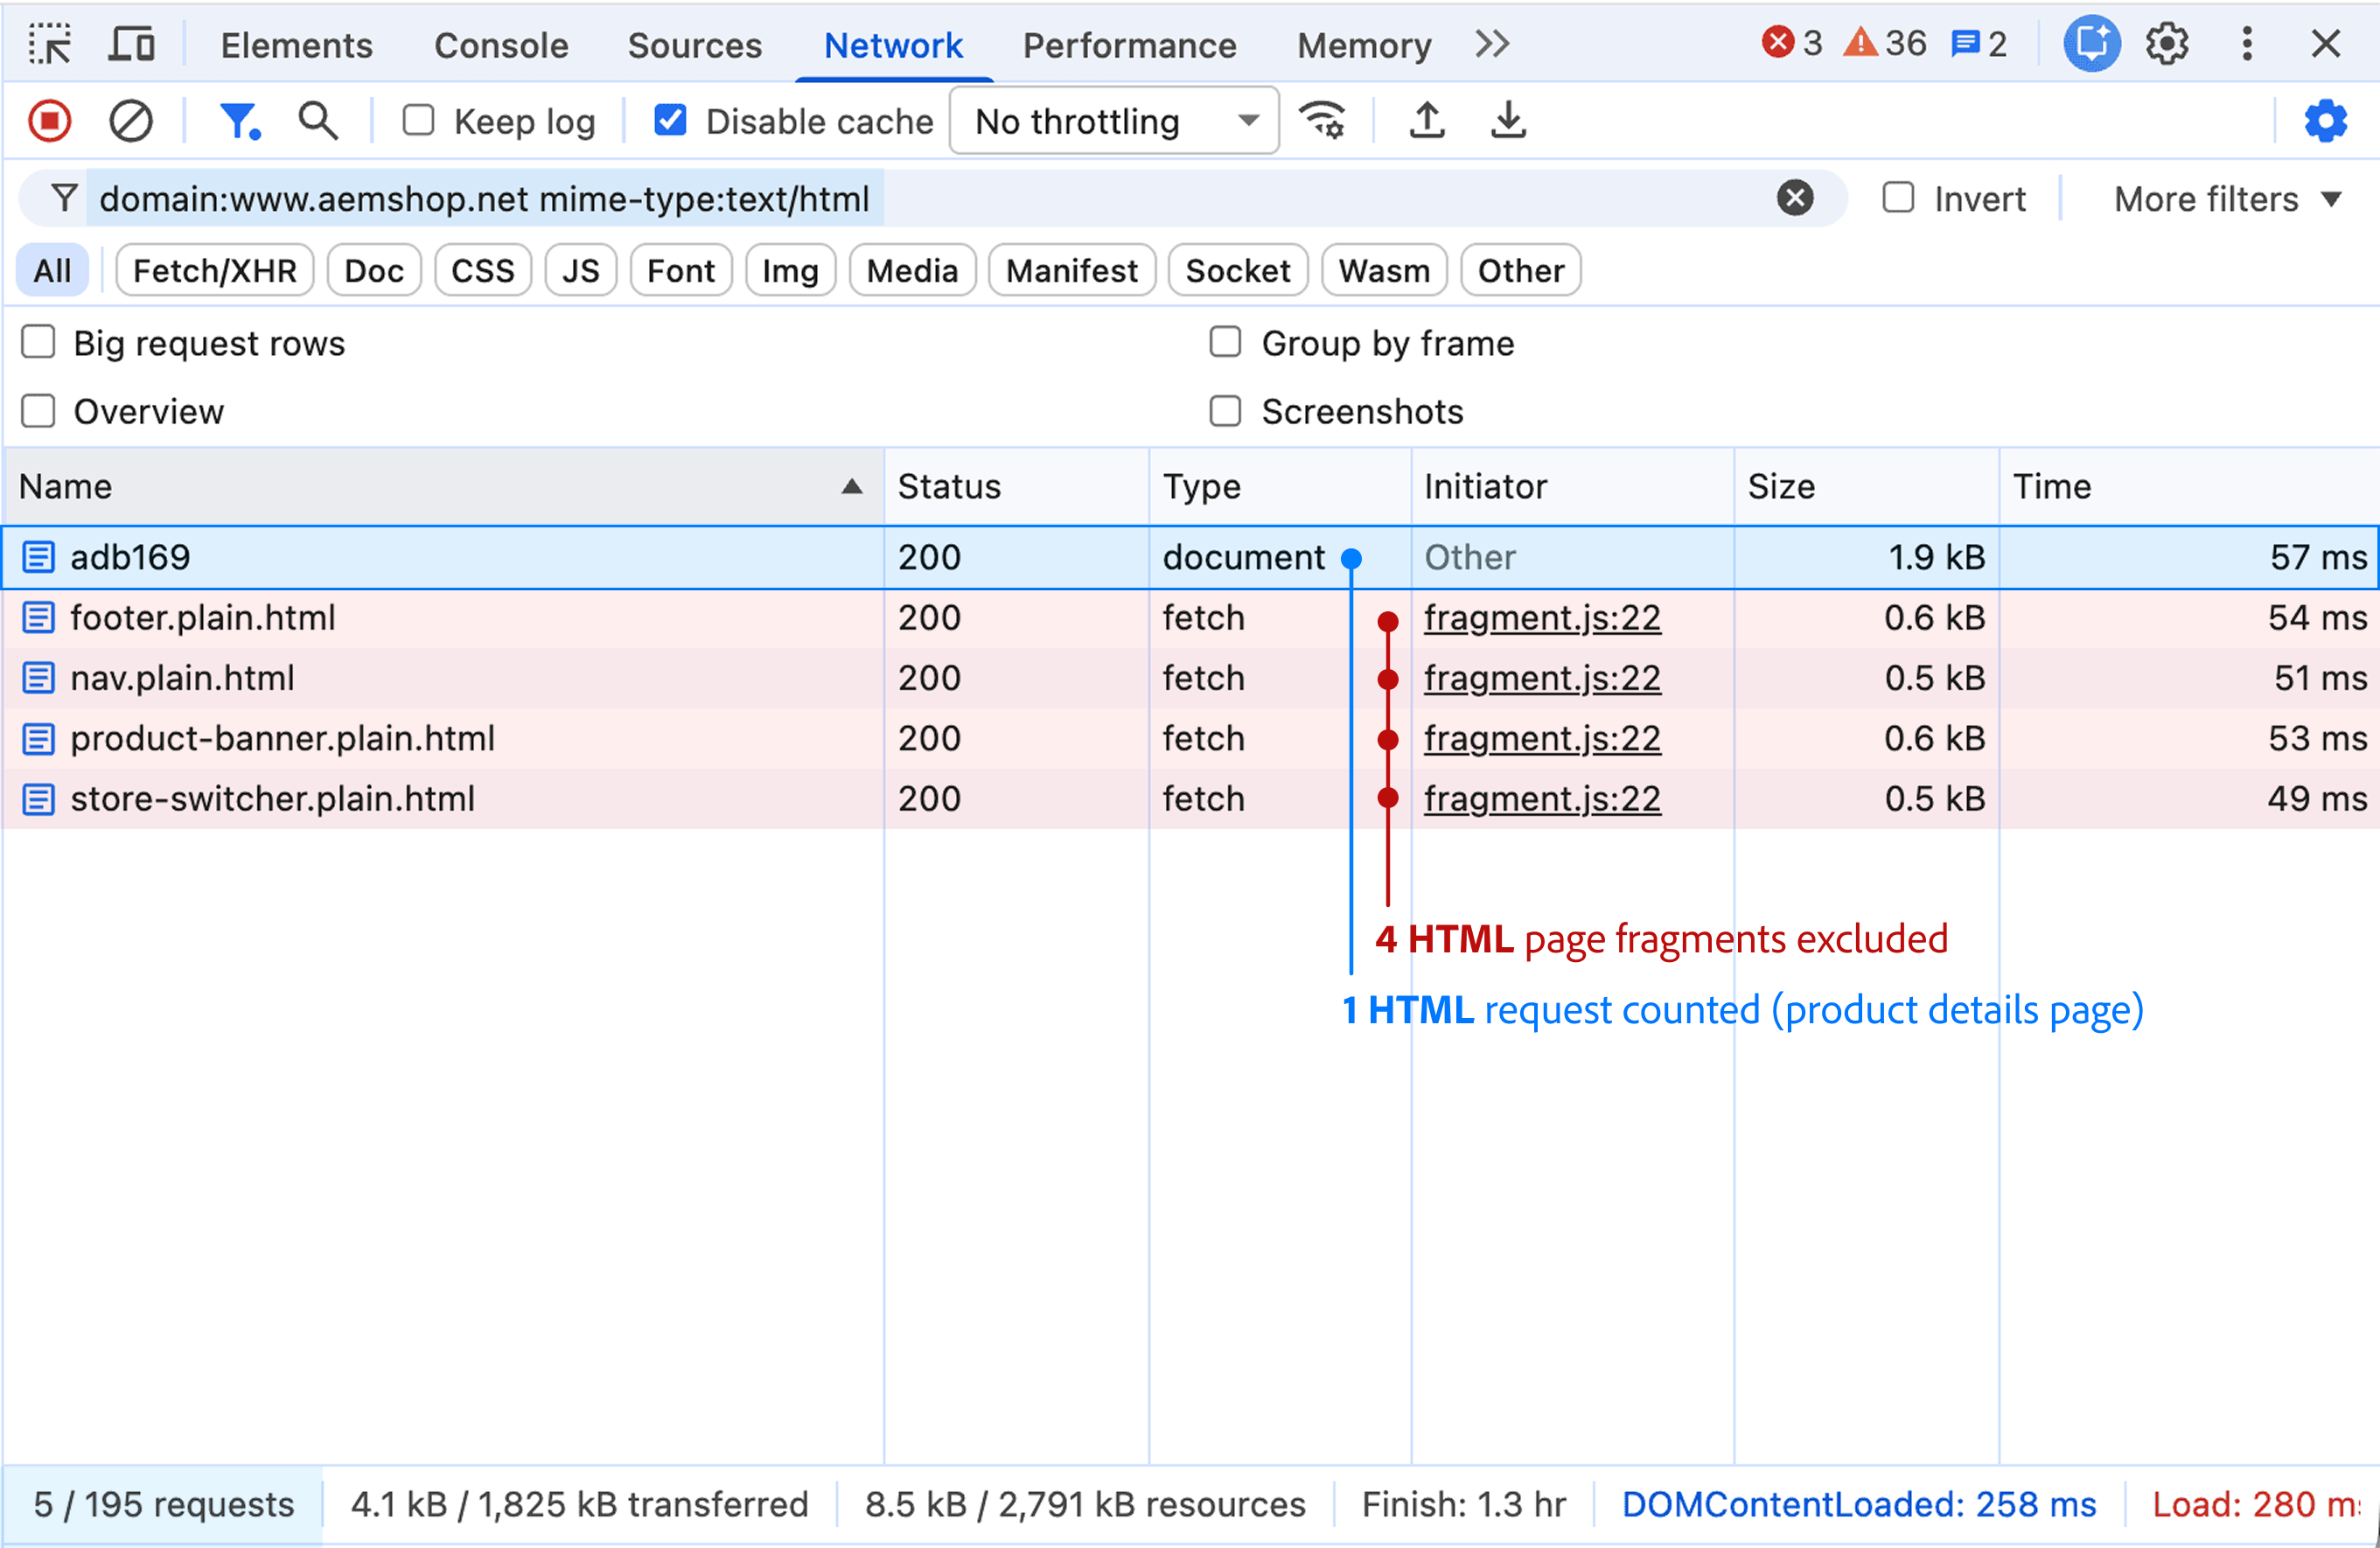 The HTML filter lists the page document and 4 fragments.
-
Replace the filter with the following one and record your JSON count the same way.
domain:www.example.com mime-type:application/json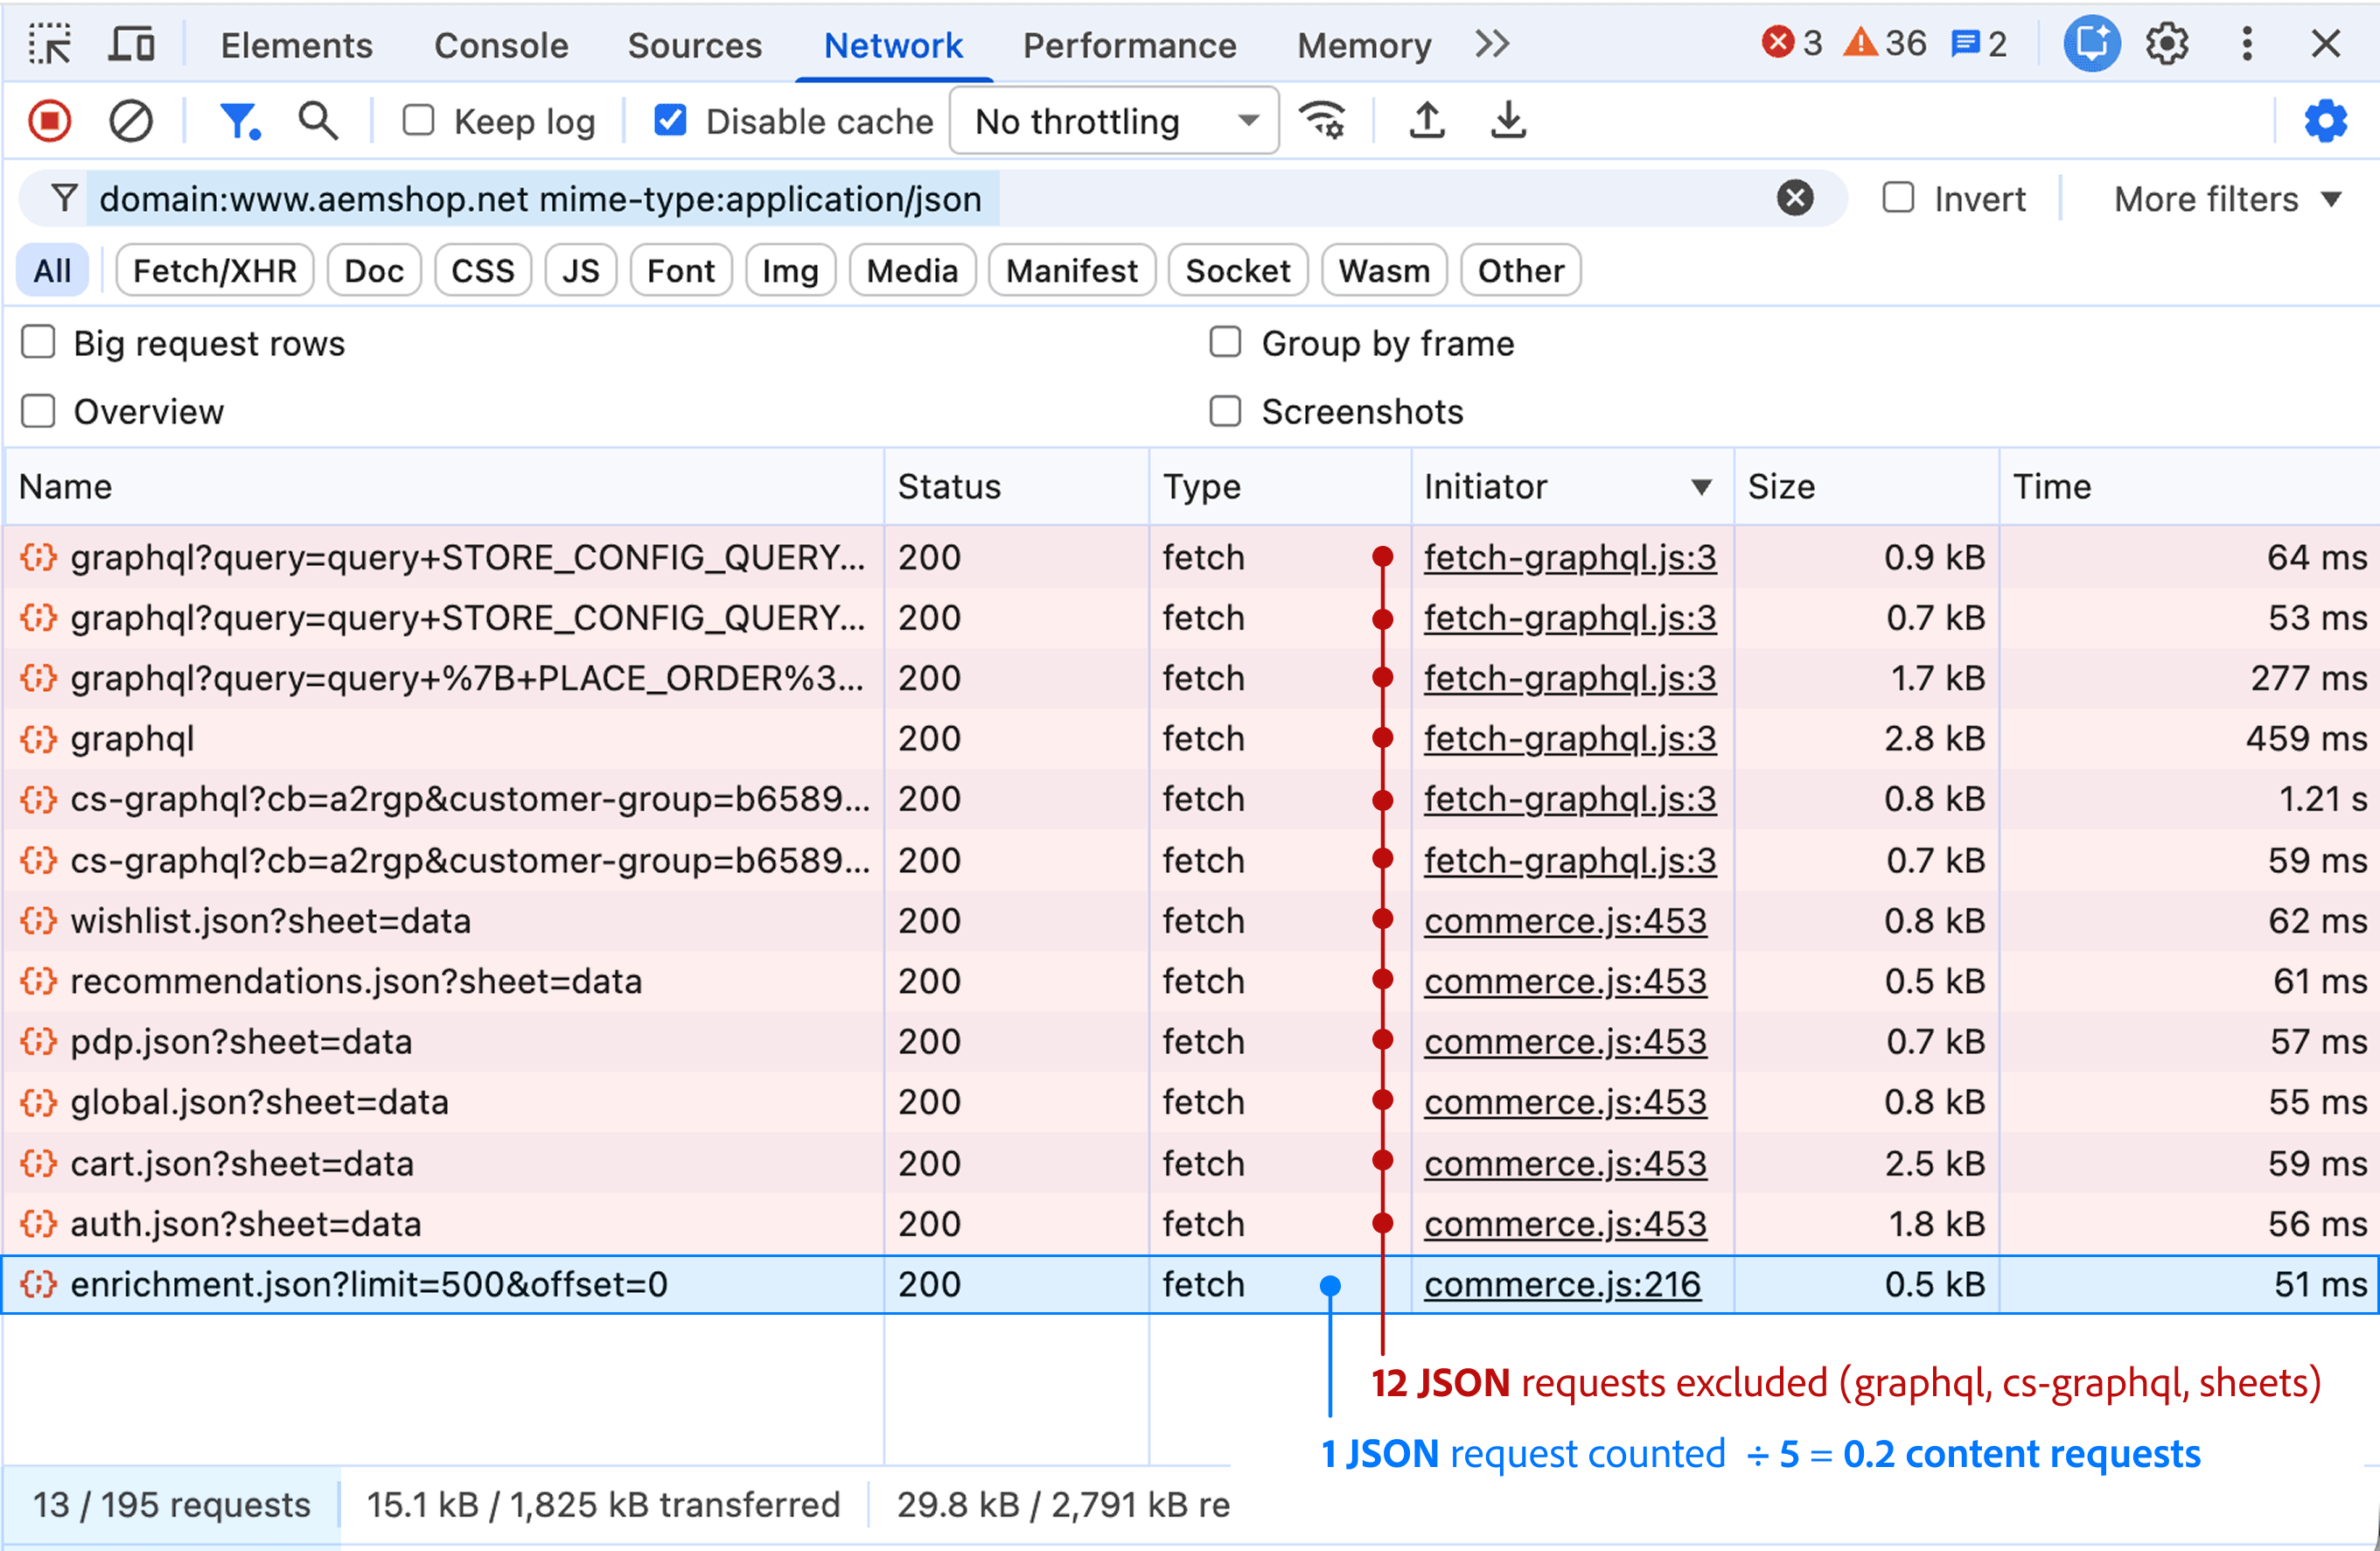 The JSON filter lists 6 placeholder files, the enrichment index, and 6 Commerce API calls.
-
Subtract requests that don’t count:
- Redirects and errors: a Status value of
300or higher, such as301or404. - HTML fragments: names ending in
.plain.html, such asnav.plain.html. - Placeholder files: any JSON file in a
placeholders/folder, such ascart.jsonin the example. To see a request’s folder, hover over its name. - Common Edge Delivery JSON files:
placeholders.json,placeholder.json,query-index.json,form-data.json, orconfig.json. - Commerce API calls: JSON requests routed directly to Adobe Commerce, such as
graphqlandcs-graphqlin the example.
If you’re not sure how a Commerce request is routed, ask your storefront team before you exclude it.
- Redirects and errors: a Status value of
-
Divide the remaining JSON count by 5 and add it to the remaining HTML count to get the content requests per page view.
Example summary
Section titled “Example summary”The demo product pages each use 1.2 content requests per view:
| Files | Browser requests | Content requests |
|---|---|---|
| Product page | 1 HTML | 1 |
| Fragments, such as the footer | 4 HTML | excluded = 0 |
Enrichment index, enrichment.json | 1 JSON | 1 ÷ 5 = 0.2 |
Placeholder files, such as /placeholders/cart.json | 6 JSON | excluded = 0 |
graphql and cs-graphql calls | 6 JSON | excluded = 0 |
| Total | 5 HTML, 13 JSON | 1.2 |
Count unopened prerendered pages per page view
Section titled “Count unopened prerendered pages per page view”A prerendered page loads its HTML and JSON files, as if the shopper were opening it, so it uses the same content requests. If the shopper then opens it, it counts only once, as a regular page view. Only unopened prerendered pages add content requests. For an example, see Calculating prerendered content requests.
The calculator needs a rate: the average number of unopened prerendered pages per page view. It multiplies that rate by your forecast page views and your average content requests per view.
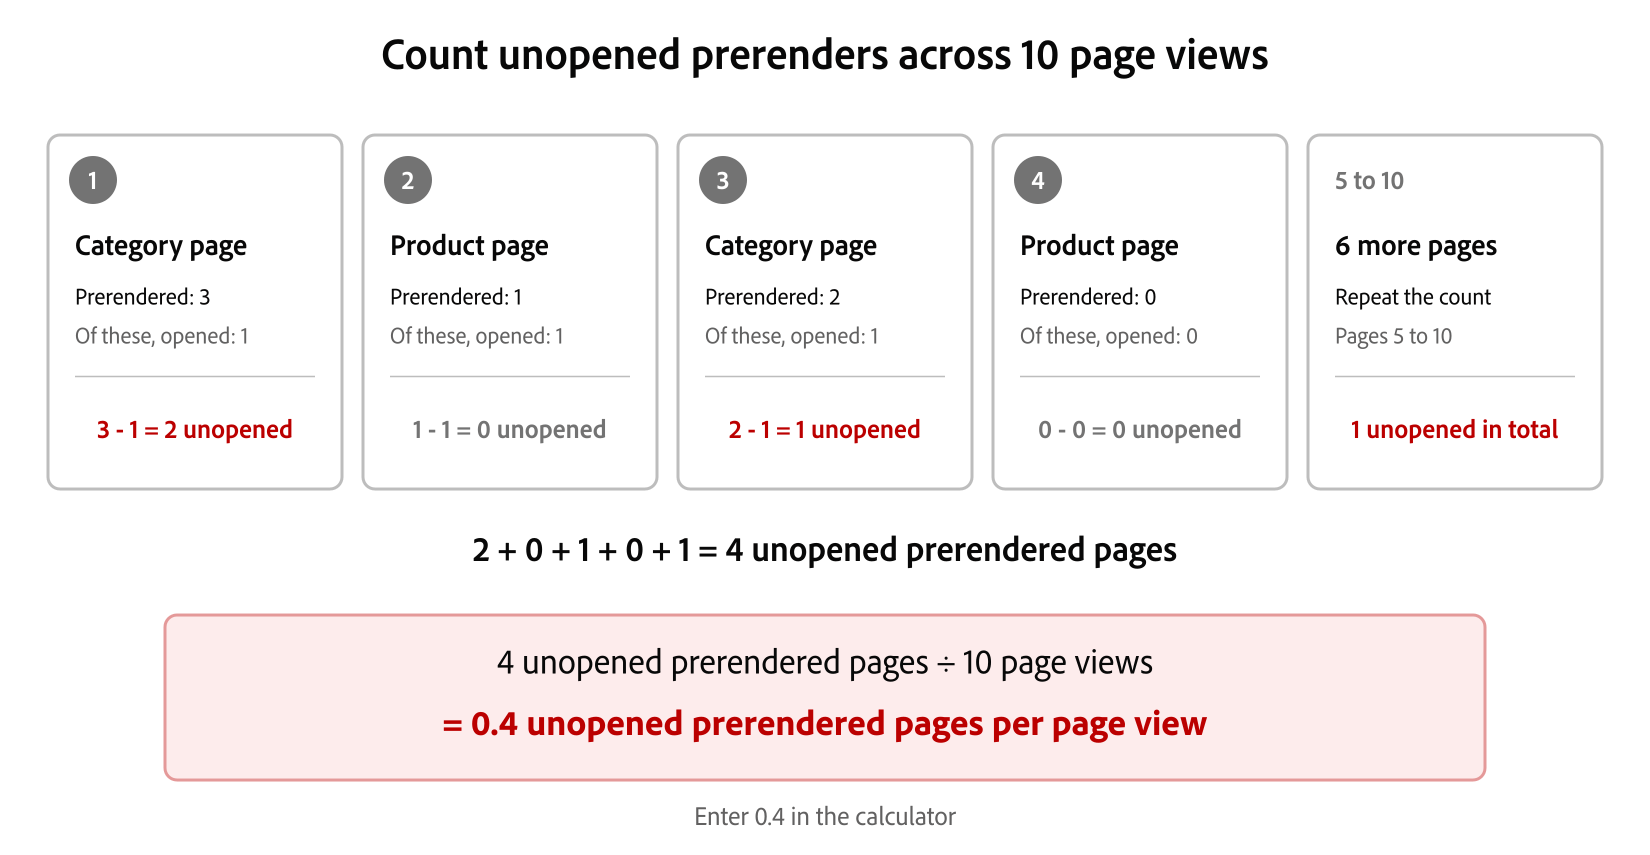
To find the rate, browse about 10 pages as if you were a shopper. Keep a running total of pages that prerender but that you don’t open.
-
Open a category page on your storefront in Chrome or Edge. In developer tools, select the Application tab. Under Background services, select Speculative loads > Speculations, and then reload the page.
The list shows the links that the browser can prerender, marked Not triggered.
-
Browse as a shopper, resting the pointer on product links. A completed prerender shows Ready.
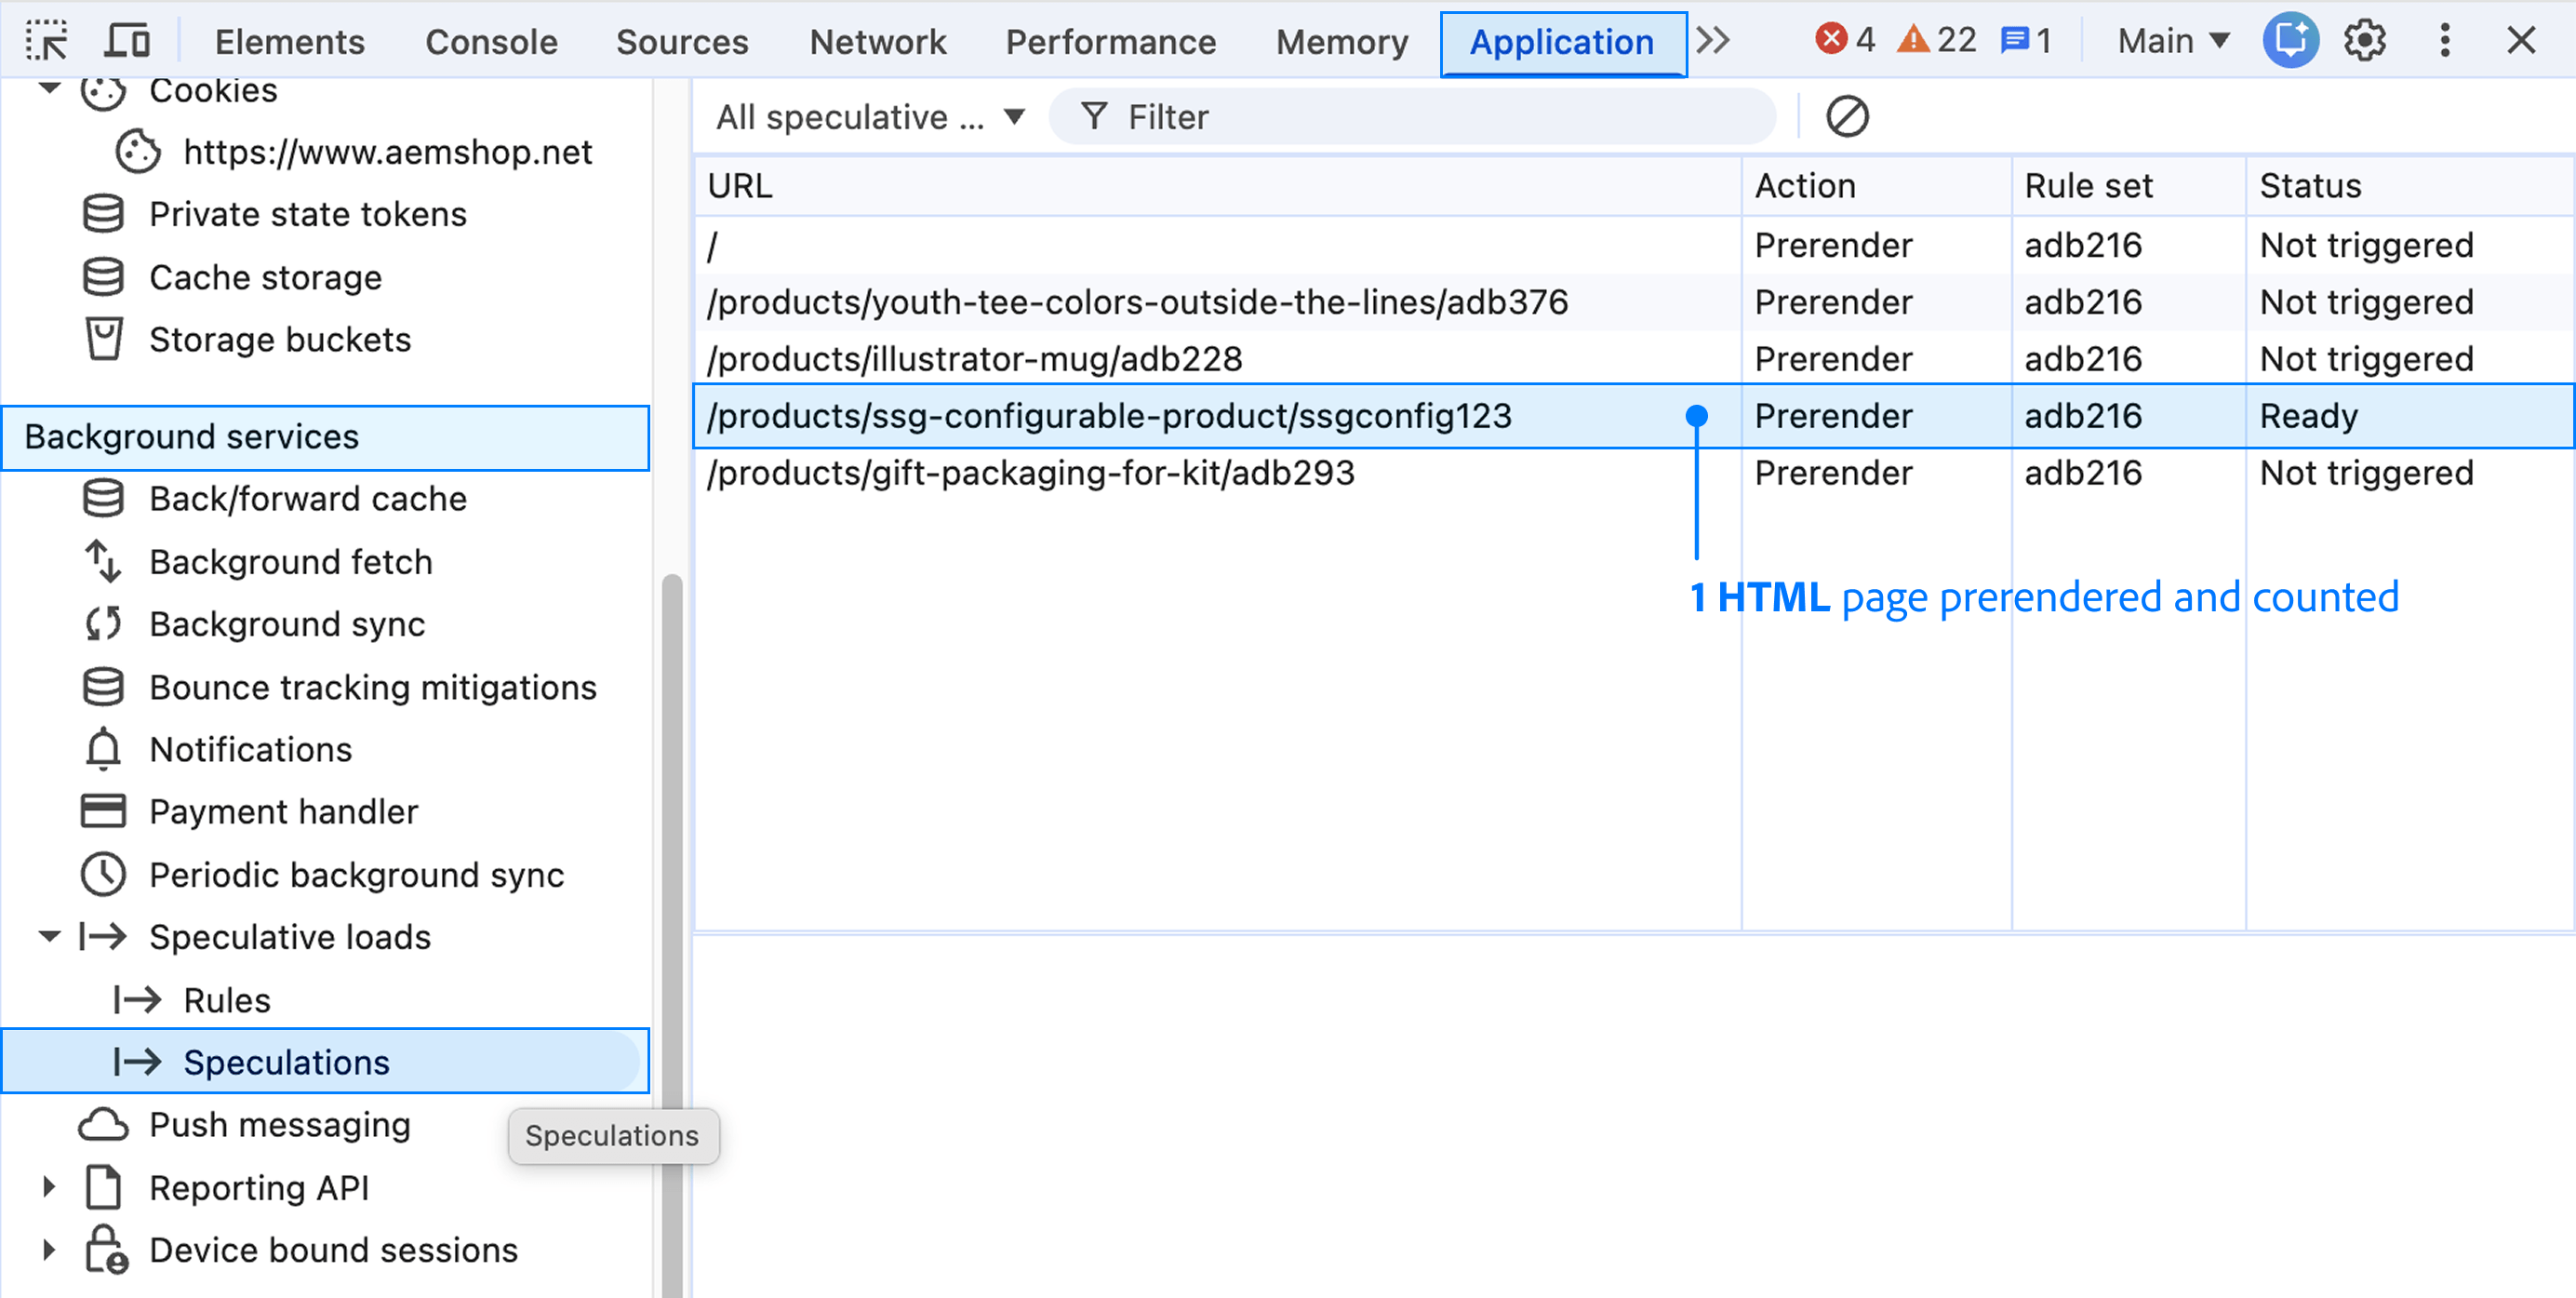 One page has finished prerendering and shows Ready. The other links show Not triggered.
-
Before opening the next page, add each row that no longer shows Not triggered, such as Ready or Failure, to your running total of unopened pages. Leave out the link you’ll open, which counts as your next page view. Include canceled prerenders, because their files may already have loaded.
-
Open the next page, and then repeat steps 2 and 3 until you’ve viewed about 10 pages.
-
Divide your total of unopened pages by the number of pages you viewed. For example, 4 unopened pages across 10 page views is 0.4. Enter the result in the Unopened prerendered pages per page view field in the forecast calculator.
Count other traffic
Section titled “Count other traffic”Headroom is an extra percentage for traffic beyond page views and unopened prerenders. This optional measurement uses CDN or server logs to find counted traffic that analytics misses, such as unrecognized bots and monitoring tools. Without it, agree on a headroom value with your storefront team.
- Separate: Split page views, unopened prerenders, and other traffic for the same period.
- Exclude: Remove requests that AEM doesn’t count, such as static assets and recognized crawlers.
- Calculate headroom from remaining traffic: The gap between logs and analytics can include prerenders you already entered, so it isn’t automatically your headroom.
- Other platforms: Their logs can identify traffic sources, but their raw request counts aren’t an AEM estimate.
For example, if your logs show 120,000 content requests from page views and prerenders, and 12,000 from other traffic, in the same period. The headroom is 12,000 ÷ 120,000 = 10%. Enter 10 in the Headroom for other traffic (%) field.
Forecast usage
Section titled “Forecast usage”Use your current site’s analytics or expected traffic for monthly page views, then enter the measurements from the sections above. Don’t use another platform’s request counts, because its pages load content differently.
Replace the example values with your own. If your storefront isn’t built yet, use the example measurements from the demo storefront as a starting point.
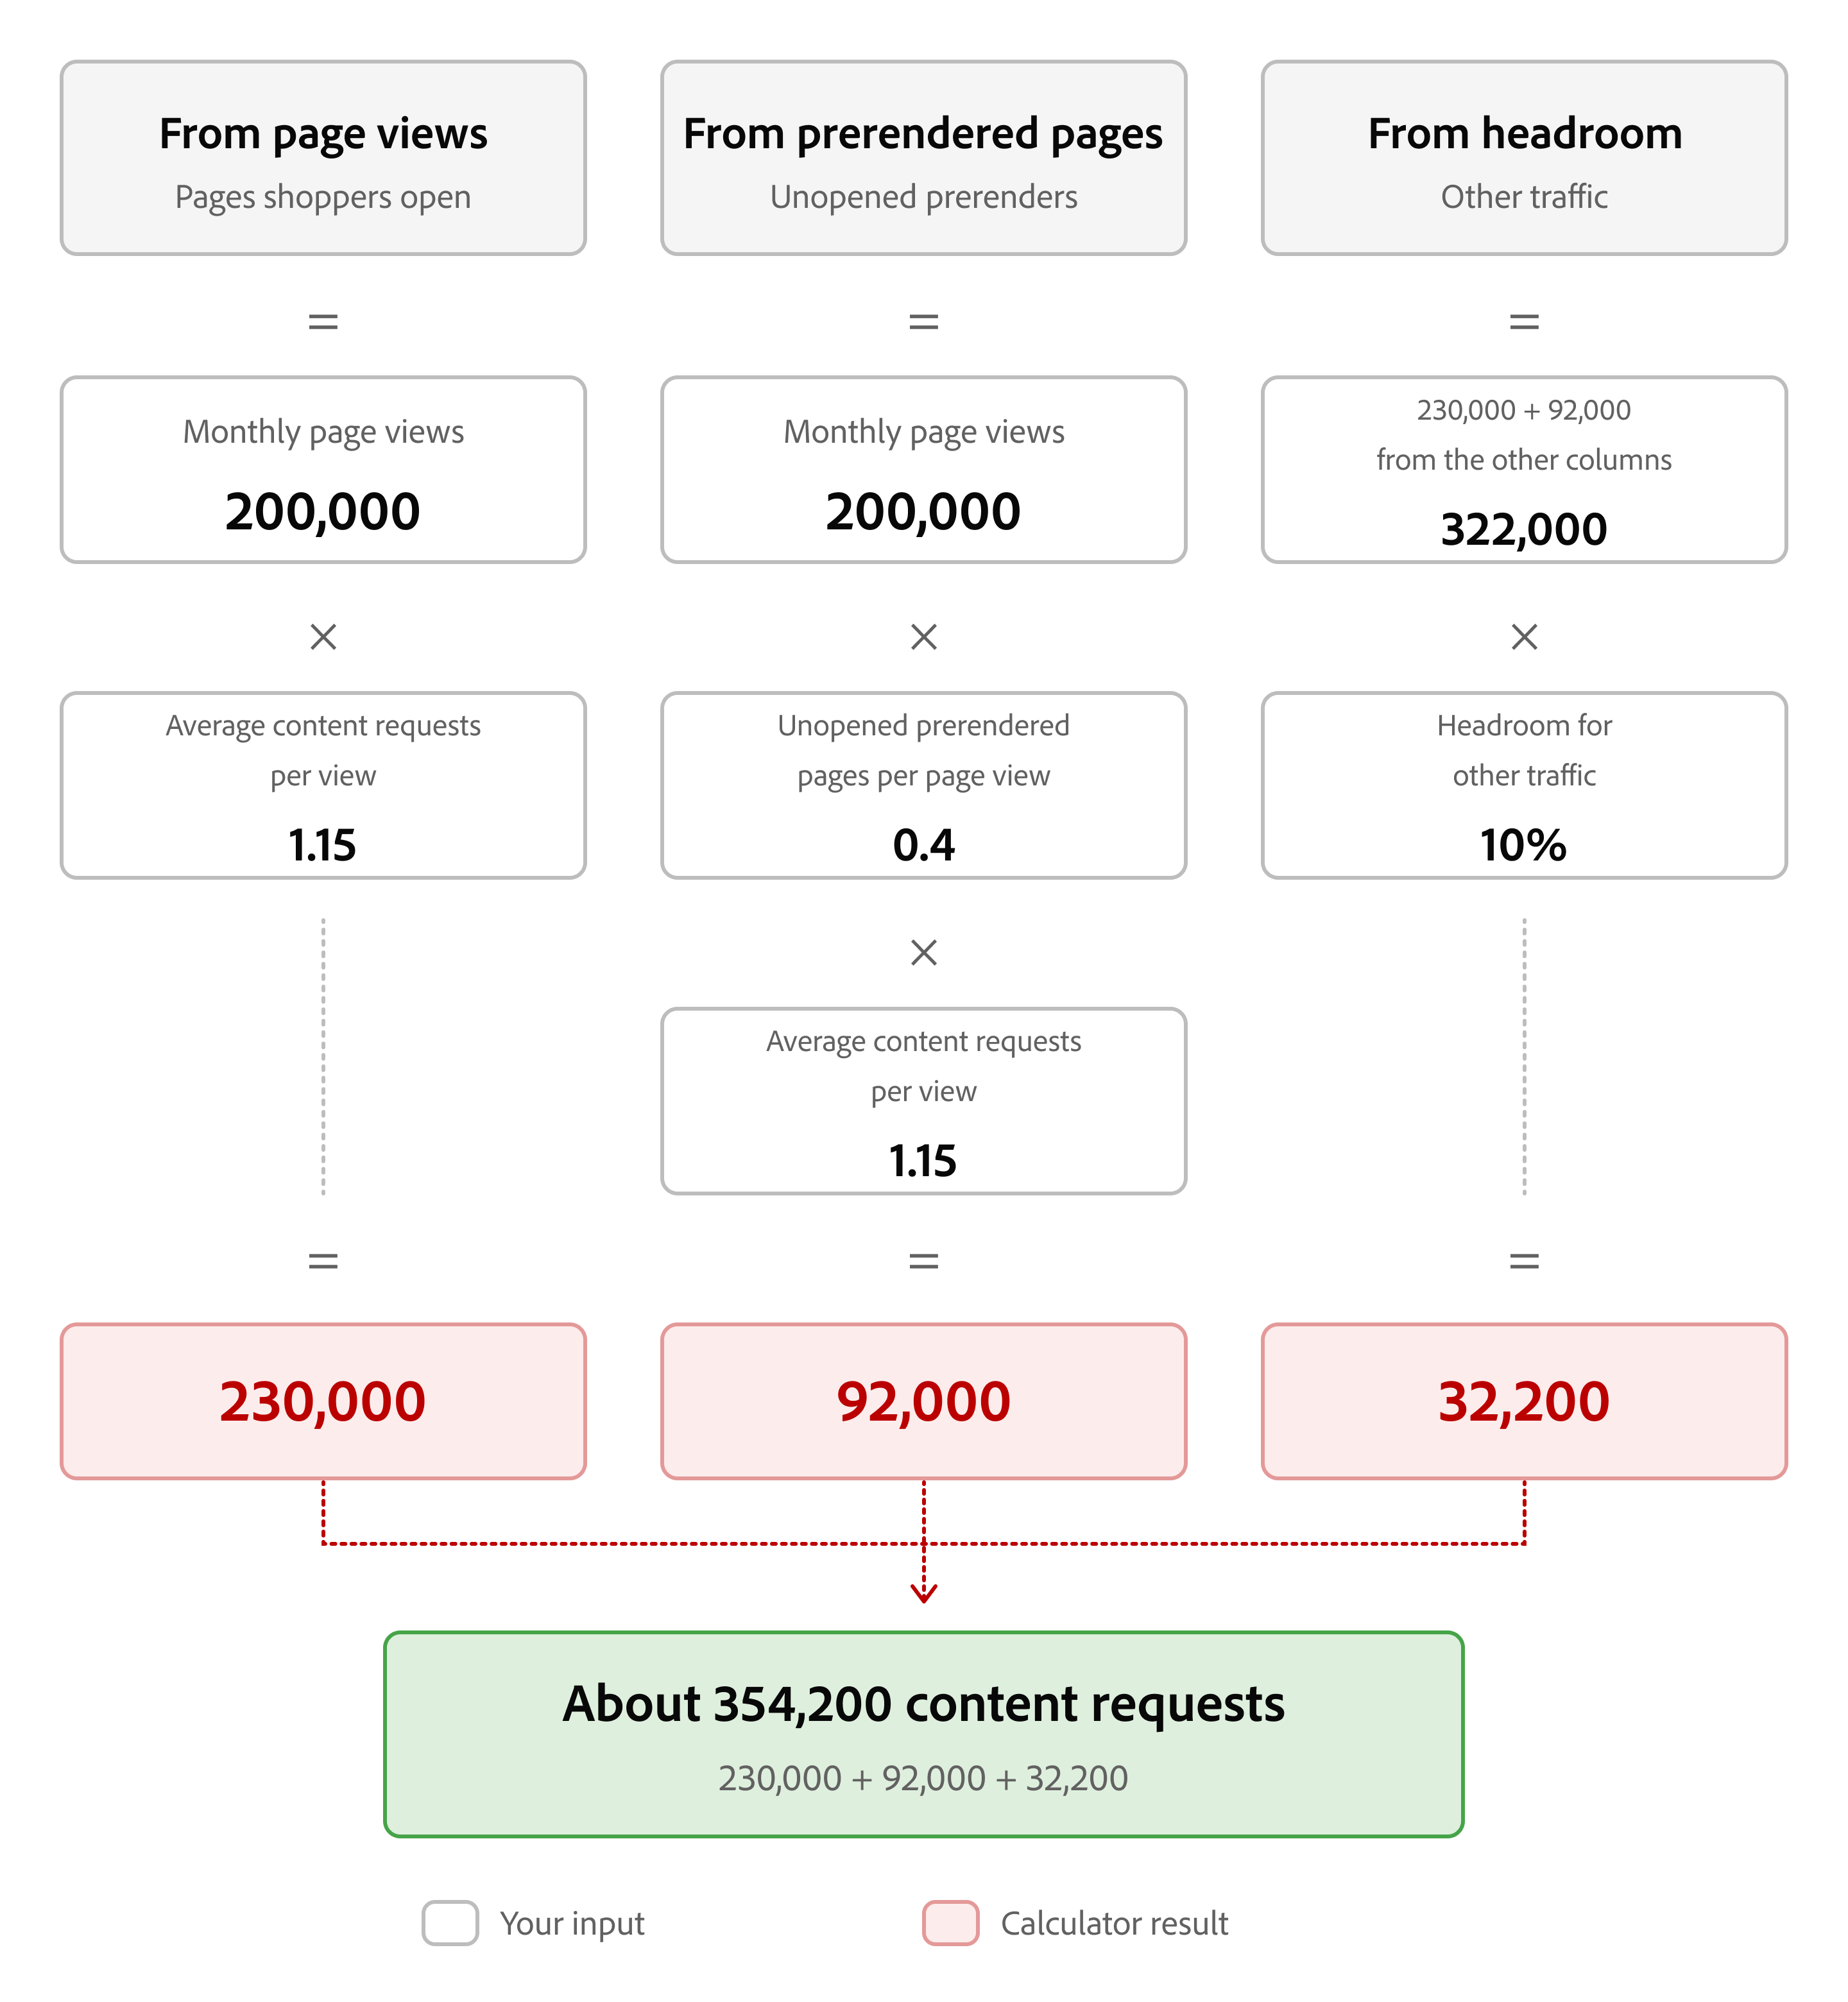
Your license includes a monthly content-request allowance. Adobe compares usage against the total allowance for each 12-month period, so lower usage in quieter months can offset higher usage in busier months.
Counting rules in detail
Section titled “Counting rules in detail”For how HTML and JSON requests count, see the AEM counting definition . For response codes, caching, bots, monitoring, and other exclusions, see the AEM server-side collection rules .
Storefront-specific exclusions
Section titled “Storefront-specific exclusions”- HTML fragments: Files ending in
.plain.html, such asnav.plain.html, don’t count. Fragments loaded from their page URL, such as/fragments/promo, count normally. - Placeholder and common Edge Delivery JSON files: JSON files in a
placeholders/folder, plusplaceholders.json,placeholder.json,query-index.json,form-data.json, andconfig.json, don’t count. - Commerce API calls: Requests sent directly to Adobe Commerce, such as
graphqlandcs-graphql, or to other services without reaching AEM, don’t count.
Some of these file exclusions aren’t listed in the AEM documentation yet.
JSON files that count
Section titled “JSON files that count”JSON files hold data that a page reads after it loads. On the demo storefront’s home, category, and product pages, only one JSON file counts: the enrichment index. Your storefront can add more when your team builds features that read published content.
| Business use | File your storefront team sees | Content requests per view |
|---|---|---|
| Banners, size guides, and promotions on product and category pages | The enrichment index, enrichment.json | 0.2 |
| Lists that authors keep in a spreadsheet, such as store locations, FAQs, or a promotions calendar | One published spreadsheet for each list that a custom block displays | 0.2 for each spreadsheet |
| Pages that list articles, such as a blog | A JSON file that lists articles. query-index.json is excluded, but indexes with other names count. | 0.2 for each index |
| Other apps that read your site’s content, such as a mobile app or kiosk | Any JSON file that the app downloads from your storefront domain | 0.2 for each file, even though no shopper views a page |
Product details, prices, search results, carts, checkout, and accounts come from Commerce API calls, which don’t count toward your content request allowance.
Account and sign-in pages
Section titled “Account and sign-in pages”When a loaded page uses JavaScript to send the shopper to another page, both pages count:
- Signed out: Opening an account page, such as the address book, redirects the shopper to sign-in.
- Signed in: Opening the sign-in page redirects the shopper to the account page.
An HTTP redirect, such as 301 or 302, doesn’t count, but the page it leads to does.
Custom content blocks
Section titled “Custom content blocks”Blocks that load extra content add requests for each file:
- Spreadsheet or index: Each adds 0.2 content requests per view.
- Full HTML page: Each adds 1 content request. Files ending in
.plain.htmlare fragments and don’t count.
Keep automated traffic from counting
Section titled “Keep automated traffic from counting”For monitoring and proxy settings, see the AEM guidance for managing content requests . Run load tests and scripts on your preview or staging site, because only production traffic counts.